Core Web Vitals explained in pictures
Author: Jon Hedges
Jon has 40 years of marketing experience in the automotive aftermarket industry.
Click for LinkedIn profile
We created these simple pictures of Core Web Vitals in action, because Core Web Vitals have weird names and acronyms! They can be really hard to understand.
There are many additional metrics to measure website speed and usability, outside of Core Web Vitals. Which ones should you pay attention to? We cover that below, too.

CLICK TO ENLARGE: Picture of Core Web Vitals at work. Scroll down in this article for examples.
Core Web Vitals changed back in 2024, so don’t rely on outdated information. Here, we simplify everything you need to know about these important metrics, and we show you how to check your own site.
Why are Core Web Vitals important?
Google says Core Web Vitals measure your user’s experience in the real world. Google places user experience very high on their list of importance.
User experience can include several things. One is unique, useful and non-generic content. Another thing is site navigation and user experience. And, of course, user experience includes site speed as measured by specific tools.
A word of caution: Don’t measure your site speed by loading your site on your computer and seeing how fast it loads! You’re probably on your site a lot and it’s probably cached in your browser’s memory. Depending on your web server it may even be on your own network.
Measuring your auto parts site’s speed
There are many metrics and tools to measure the speed and usability of an auto parts and accessories website. Or even an auto dealership site.
Core Web Vitals includes three metrics that measure site speed and usability. These three are the most important to start with in this article.
We so cover some additional page speed metrics farther down, scroll down to see more. And, also note that these page speed metrics play a role in our Hedges & Company SEO website audits.
How to measure Core Web Vitals
The primary ways to measure Core Web Vitals are by using Google Search Console, PageSpeed Insights, or a Chrome browser extension. We detail this at the bottom of this article.
Largest Contentful Paint (LCP)
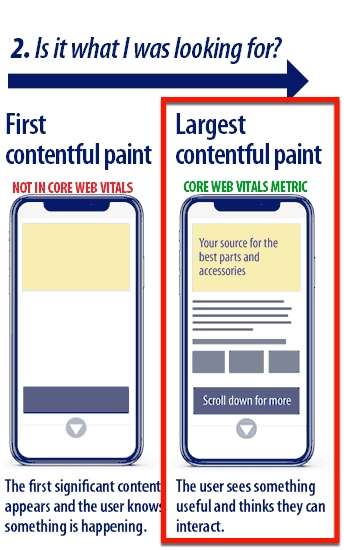
A picture of Largest Contentful Paint (LCP) in action. Click for a larger image.
Translation: The user sees something useful as a website starts to load.
Largest Contentful Paint (LCP) is simply the amount of time it takes for the largest piece of content on a webpage to become visible to the user. LCP measures loading performance.
This content could be an image, a video, or a block of text. LCP is important for user experience because it gives an idea of when the most significant part of the page is loaded and ready for the user to see and interact with.
A faster LCP generally means a quicker and more enjoyable experience for website visitors. That’s why Google considers this to be important.
Google wants LCP completed within 2.5 seconds.
Cumulative Layout Shift (CLS)
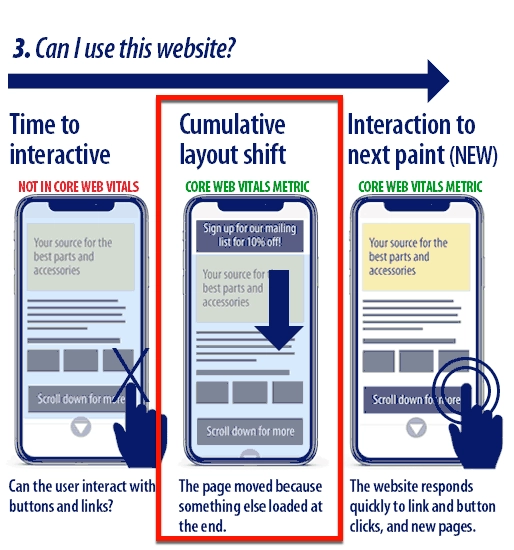
A picture of Cumulative Layout Shift (CLS) in action. Click for a bigger image.
Translation: Things move on the page as other things load.
Cumulative Layout Shift (CLS) is simply how much things on a page move around as the page loads, or “visual stability.”
It quantifies how stable a page is when loading. For example, when you’re trying to read or interact with a page, it’s frustrating if buttons or text suddenly shift, leading to unintended clicks or confusion. That’s why Google considers this to be important.
Usually CLS makes elements on a page shift down, but things can shift left or right, too.
CLS helps assess and improve the user experience by measuring how stable the page layout as it loads. A lower CLS score generally means a more visually stable and user-friendly website.
Google wants a CLS score of 0.1 or less.
Interaction to Next Paint (INP)
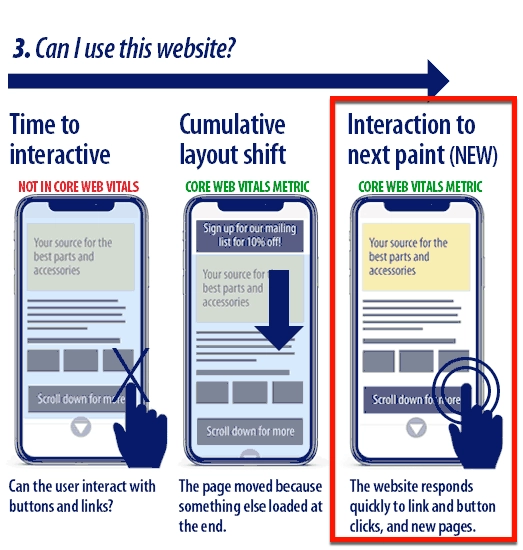
A photo of INP on a website. Click for larger image.
Translation: The website now responds to clicks.
Interaction to Next Paint (INP) measures how quickly a website responds to a mouse click, pressing a key or a tap on a touchscreen.
Interaction to Next Paint is a continuous measurement, while First Input Delay just measures the first interaction. Google likes INP because it measures how a user continues to interact with a site, not just the first interaction.
Google wants INP completed in 200 milliseconds.
INP replaced First Input Delay (FID) back in March 2024.
Important non-Core Web Vitals metrics made simple
At the beginning of this article we said there were many additional metrics to measure a website that are not part of Core Web Vitals. They’re still important to know.
Time to First Byte (TTFB)
Translation: server speed.
Time to First Byte is a measurement of how quickly a server responds to a new web page visitor and starts to load a page. That’s a bit of an oversimplification but to keep things simple, we’ll go with server response time.
It’s also possible to get an artificially slower TTFB in a test. That’s because tools like PageSpeed Insights and GTmetrix add their own latency to simulate the real world (scroll down and read about lab data vs. field data).
First Paint (FP)
Translation: I think I see something happening.
The First Paint metric measures the time it takes for you to notice something happening when you visit a web page.
First Contentful Paint (FCP)
Translation: I’m now sure something is happening.
First Contentful Paint is the first meaningful thing rendered on the page. It reassures the user that something is happening. This happens before Largest Contentful Paint.
Time to Interactive (TTI)
Translation: I can interact with this page and click on things.
Time to Interactive measures how quickly a user can click on buttons, links, forms, see the navigation menu or scroll.
DOM Content Loaded (DCL)
Translation: The page is done loading…for now…but more may be coming.
DCL means the HTML part of your web page finishing loading and all JavaScript scripts have fired, including any scripts that may have been deferred. It doesn’t wait for images, asynchronous scripts, most css files or iframes.
Deprecated Core Web Vitals
First Input Delay (FID)
Translation: Users think they can interact, but can’t yet.
Interaction to Next Paint replaced First Input Delay in March 2024 and FID went away in September 2024. First Input Delay (FID) was a measurement on how long it took for a user to be able to interact with a website for the first time.
It looked at the delay between a user’s first interaction, such as clicking a button or a link, and the website’s response to that action. FID helped assess the responsiveness of a website but it was replaced with INP because FID was a measurement of the first interaction, while INP was a continuous measurement. INP is a better measurement of how a user is able to engage with a website for the duration of the time spent on the website.
How to check your Core Web Vitals
There are several ways to measure the speed and usability/responsiveness of your website. There are specific metrics for site speed, they’re free to use and they’re all available four main ways through the Google ecosystem: Lighthouse Core Web Vitals, a tool that measures speed, SEO best practice and usability; Google Search Console, a tool that monitors your site’s performance, ranked keywords, organic clicks and impressions; Google’s PageSpeed Insights; and Google’s Chrome User Experience Report (CrUX for short), a tool that measures site speed and usability.
There are also a lot of non-Google tools to monitor Core Web Vitals including GTmetrix and WebPageTest.org.
The CrUX Dashboard is really handy because you can create your own report in Google LookerStudio.
Here are the differences with the four Google Core Web Vitals checkers (on a phone? scroll right):
| Metric | Lighthouse | Google Search Console | Chrome User Experience Report (CrUX) | PageSpeed Insights |
| First Paint | ||||
| First Contentful Paint | ||||
Largest Contentful Paint (LCP) | ||||
| Cumulative Layout Shift (CLS) | ||||
| Interaction to Next Paint (INP) | ||||
| Time to First Byte (TTFB) | ||||
| DOM Content Loaded | ||||
| Total Blocking Time (TBT) | ||||
| Speed Index | ||||
| HTTPS |
Website usability metrics and Core Web Vitals in the past
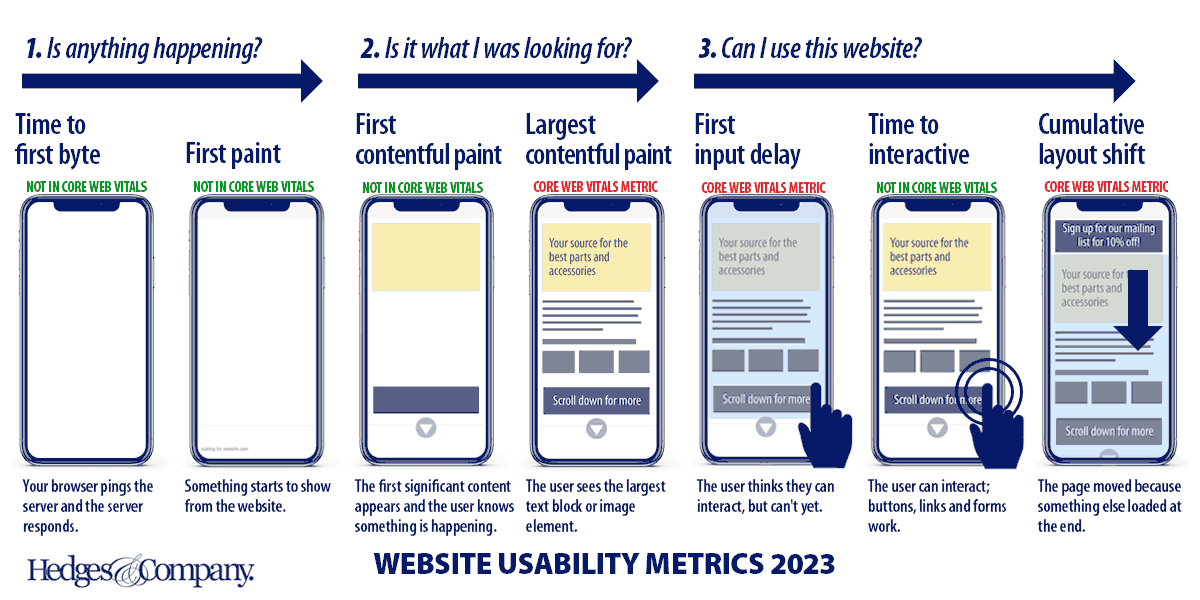
CLICK TO ENLARGE: Important web usability metrics including Core Web Vitals, before Interaction to Next Paint (INP) replaces First Input Delay (FID).
This graphic shows the important metrics to measure site speed using the 2023 version of Core Web Vitals.
Google prefers the new Interaction to Next Paint (INP) metric, because it measures the responsiveness during a user’s entire time on a website. That’s why it replaced First Input Delay (FID) in March 2024, which only measures the first time a website is able to respond.
Why are these web performance KPIs important?
Don’t take our word for it that web performance KPIs (key performance indicators) are important. Check out WPOstats.com if you aren’t convinced that web page metrics and Core Web Vitals are important. It’s full of case studies with before/after results showing improvements in conversion rate vs. improvements in site speed and performance.
Improving site speed and performance usually leads to a lower bounce rate and a better conversion rate. That’s backed up by countless studies, including our own, comparing conversion rate to site speed.
Field vs. lab data: knowing if your web performance KPIs are real
OK, we showed you how to measure your site’s performance, and we showed you the important metrics to know. But if you run a test, how do you know the results are valid?
Great question!
There are two data sources to be aware of: field data and lab data.
Field data comes from thousands of real site visits to your website, by real users, on all pages, using a rolling 28 day average (assuming your site has visitors and isn’t new). The term “real user monitoring” or RUM is sometimes used, it’s the same thing.
Field data is stored in a massive, massive public dataset, pulling from millions of websites.
Lab data uses one test, on one page, in a controlled environment. Some of the sources for metrics in the table above use field data, some use lab data.
Here’s a comparison of data (on a phone? scroll right):
| Lighthouse | Google Search Console | Chrome User Experience Report (CrUX) | PageSpeed Insights | WebPageTest | GTmetrics | |
| Data Source: | Lab data | Field data | Field data | Both | Lab data | Lab data |
Field data (historic 28 days) is great for reviewing the overall performance of your auto parts and accessories website over time. It’s a great high-level point of view and it can show you overall trends.
Lab data (individual pages in real time)is great for debugging specific pages.
PageSpeed Insights field data vs. lab data
It’s important to know, if you use Google’s PageSpeed insights, it reports both lab and field data. This is one of the most misunderstood thing about PageSpeed Insights, which looks like it is reporting lab data. When you run a page through PageSpeed Insights, the performance scores you see from 0 to 100 are using lab data. The Core Web Vitals stats come from field data.
We hope this article was helpful. Now, go test your website!
Frequently asked questions on Core Web Vitals
Q: What are Core Web Vitals?
A: Core Web Vitals are key performance indicators for website speed and usability, focusing on three main metrics: Largest Contentful Paint (LCP), Cumulative Layout Shift (CLS), and Interaction to Next Paint (INP).
Q: What is Largest Contentful Paint (LCP)?
A: Largest Contentful Paint (LCP) measures the time it takes for the piece of content on a webpage, such as an image or text block, to become visible to the user. It indicates how quickly a page provides meaningful content.
Q: What is Cumulative Layout Shift (CLS)?
A: Cumulative Layout Shift (CLS) quantifies how much elements on a webpage move around as the page loads. Lower CLS scores indicate a more user-friendly and stable experience.
Q: What is Interaction to Next Paint (INP)?
A: Interaction to Next Paint (INP) measures how quickly a website responds to user actions, such as a mouse click, pressing a key or a tap on a touchscreen. It replaced First Input Delay (FID) in March 2024 and measures responsiveness over the entire user session.
Q: What tools can measure Core Web Vitals?
A: Core Web Vitals can be measured using tools like Google Lighthouse, Google Search Console, PageSpeed Insights, and the Chrome User Experience Report (CrUX). Non-Google tools include GTmetrix and WebPageTest.org.
This article is copyrighted, but it’s polite to share! This content is licensed under a Creative Commons Attribution-ShareAlike 4.0 International License and can be distributed or quoted, with attribution given to Hedges & Company, and a link back to this article from your website.