How Many Cars Are
In the US?
US Vehicle Registration Statistics

US Vehicle Registration Statistics
US Vehicle Registration Statistics
This page gives a snapshot of how many cars are in the US in 2025. Hedges & Company did an analysis in January 2025 and did a major update in June 2026. We estimate there are 297.5 million registered vehicles in the US, including classic cars, pre-1982 vehicles, and all light, medium and heavy duty vehicles. Older classic cars and anything pre-1982 tends to get under-reported in online VIO articles. Since those cars are so vital to the automotive aftermarket we make sure to include them.
“Cars in the US” is used generically. This actually includes all trucks, SUVs and vans. Hedges & Company has been tracking vehicles in operation (VIO) and the number of cars and other vehicles in the US for over 15 years.
Automobile statistics take into account every car-owning household in the nation including vehicle owner demographics by year, make and model, GVWR classes, household income, employment, married status, consumer buying histories, ethnicity and more.
The compound annual growth rate (CAGR) for the US vehicle population is 1.23% for 2020 through 2026.
Hedges & Company projects 313.36 million vehicles in 2030. That is a compound annual growth rate of 1.17% for 2025 through 2030.
TL;DR: Hedges & Company estimates there are about 135.3 million households1 at the start of 2026. Of those US households, about 124.5 million households2 have a car. To put it another way, 92% of all US households have a car.
10.8 million US households don’t have a car in 20262.. To put that another way, 8% of US households don’t have a car.
If need to reach new customers and grow your sales, rely on the most complete and current consumer mailing lists in the automotive aftermarket. Our vehicle ownership masterfile has the year, make and model of 170 million US consumers including automobile, truck and motorcycle owners, and we can drill down to DIY consumers with a buying history of aftermarket parts and accessories.
For mailing lists, see our automobile mailing list page, or auto dealers may be interested in our automotive direct mail list page. Here’s a link if you want to know how many cars there are in the world.
1US Census Bureau, Families and Households survey, Hedges & Company projection
2US Bureau of Transportation, Hedges & Company analysis
This table includes all passenger cars, light trucks and SUVs, as well as medium duty and heavy duty trucks. We’re estimating 298.7 million registered vehicles in the US, including classic cars, pre-1982 vehicles, and all light, medium and heavy duty vehicles.
| Registered Vehicles in US By Year | Vehicle Registration Statistics |
|---|---|
| Registered vehicles in US 2030 (proj.) | 313.4 million |
| Registered vehicles in US 2029 (proj.) | 309.0 million |
| Registered vehicles in US 2028 (proj.) | 306.1 million |
| Registered vehicles in US 2027 (proj.) | 302.1 million |
| Registered vehicles in US 2026 (est.) | 297.5 million |
| Registered vehicles in US 2025 | 293.9 million |
| Registered vehicles in US 2024 | 292.5 million |
| Registered vehicles in US 2023 | 284.6 million |
| Registered vehicles in US 2022 | 282.2 million |
| Registered vehicles in US 2021 | 281.2 million |
| Registered vehicles in US 2020 | 275.9 million |
| Registered vehicles in US 2019 | 276.5 million |
| Registered vehicles in US 2018 | 273.6 million |
| Registered vehicles in US 2017 | 272.5 million |
This table includes light-duty vehicles as well as medium- and heavy-duty vehicles, GVWR classes 4-8, which are often left off of VIO counts seen around the internet. This table also includes vehicles with a VIN year of 1982 and earlier, and these older vehicles are also often left off of VIO counts, too.
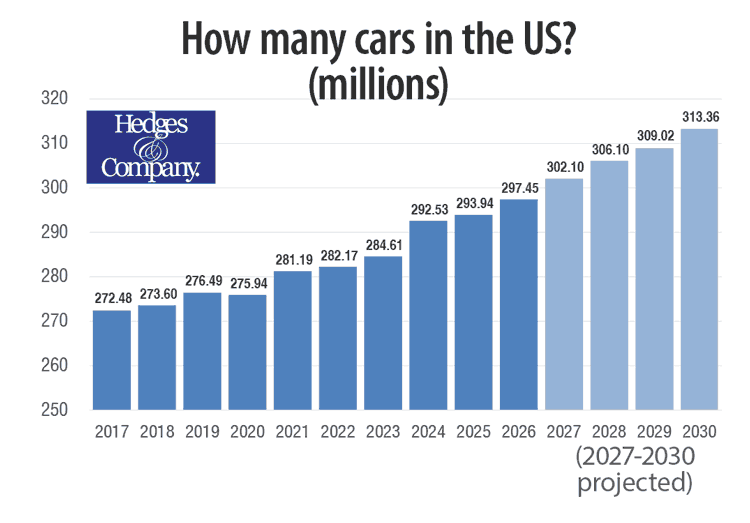
Cars; light-, medium- and heavy-duty trucks; pre-1982 vehicles in the US in millions, 2017-2030 (CLICK FOR BIGGER IMAGE).
There are 297.5 million vehicles on the road in the US in 2026 and they’re getting older.
All light vehicles, combining cars and light trucks, have an average age of 12.8 years in 2025, and by 2029 the average age is projected at 13.9 years. Trucks have remained relatively unchanged at around 12.1 years, but the average age of cars is now over 14.
Consumers hold on to their cars and trucks longer. Better car and truck reliability and vehicle technology are big reasons for the increasing age of the US car parc. With the slowdown in new vehicle sales in recent years, the age of the average vehicle in the US will continue to creep upwards.
About 92.1% of US households, or 120.8 million US households, have at least one car or light truck.
There is an FAQ section at the bottom of this page for quick reference on vehicle statistics.
Vehicle registration data is something we’ve analyzed for two decades, but we also feature highly accurate automotive mailing lists.
Click here to learn “what is GVWR?”
Looking for vehicle registration data/Vehicles in Operation (VIO) for foreign or domestic automobile and truck makes? Our vehicle data includes demographic data and ownership data on the following makes: Acura, Audi, Bentley, BMW, Bugatti, Buick, Cadillac, Chevrolet, Chrysler, Daewoo, Dodge, Eagle, Fiat, Ford, Geo, GMC, Honda, Hummer, Hyundai, Infiniti, Isuzu, Jaguar, Jeep, Kia, Lancia, Land Rover, Lexus, Lincoln, Mazda, Mercedes-Benz, Mercury, Merkur, Mini, Mitsubishi, Nissan, Oldsmobile, Plymouth, Pontiac, Ram, Saab, Saturn, Scion, Smart, Subaru, Suzuki, Tesla, Toyota, Volkswagen and Volvo.
There are over 8 million motorcycles registered in the United States. If you need registration statistics for motorcycles, or mailing lists to reach motorcycle owners, we can help. Need mailing list data for motorcycles or ATVs? Motorcycle makes in our masterfile include Aprilia, Big Dog, BMW, Buell, Can-Am, Ducati, Harley-Davidson, Honda, Indian, Kawasaki, KTM, Piaggio, Suzuki, Triumph, Victory and Yamaha.
We have household income, employment, married status, consumer buying histories, primary household language, multiple vehicles owned, and more all by year/make/model.
Need exotic and high-end vehicle data? Our masterfile also includes hard-to-find lists and data on exotic makes like Alfa Romeo, Aston Martin, DeTomaso, Ferrari, Lamborghini, Lotus, Maserati, Maybach, Panoz, Porsche and Rolls Royce.
More information on vehicle registration data and the process it goes through is available in this blog post “Everything You Need to Know About Vehicle Registration Data.” That post covers how the data comes in from DMVs, how the data is cleaned up and standardized, and important ways it is different from vehicle data released by the U.S. government.
Hedges & Company offers a full selection of automotive digital marketing services to put your products in front of those most likely to purchase.
A: Hedges & Company estimates there are 297.449 million registered vehicles in the US, including classic cars, pre-1982 vehicles, and all light, medium and heavy duty vehicles. The analysis was completed in June 2026.
A: Hedges & Company shows a 1.23% compounded annual growth rate (CAGR) for 2020 through 2026.
A: Hedges & Company forecasts there will be 313.361 million registered vehicles in the US by 2030, including classic cars, pre-1982 vehicles, and all light, medium and heavy duty cars and trucks. The forecast is a 1.17% compounded annual growth rate (CAGR) for 2025 through 2030. The analysis was completed in June 2026.
A: Hedges & Company estimates 124.5 million US households have at least one car, which is 92% of all 135.26 million US households at the beginning of 2026.
A: Hedges & Company estimates 10.8 million US households don’t have a car, which is 8% of all 135.26 million US households at the beginning of 2026.
A: Hedges & Company has been tracking statistics on cars and trucks in the US since 2009.