How Many Cars Are There In The World?
Author: Jon Hedges
Jon has 40 years of marketing experience in the automotive aftermarket industry.
Click for LinkedIn profile
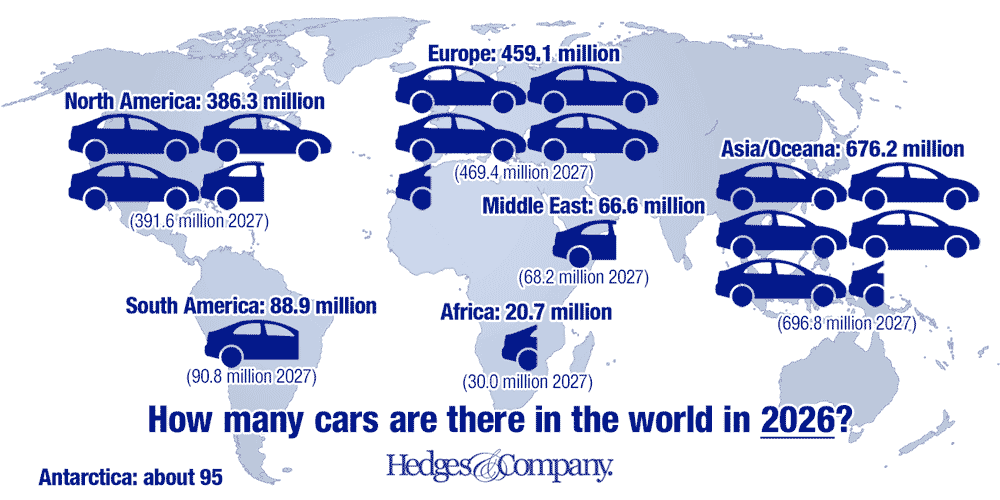
There are about 1.699 billion cars in the world in 2026. Click to enlarge the graphic.
If you want to know how many cars are there on Earth, there are about 1.699 billion vehicles in the world in 2026, based on a data analysis done by Hedges & Company in May 2026.
Total vehicles are projected at 1.738 billion in 2027.
Only about 18% of those vehicles are in the United States. We’ll get into more detail on how many cars are there in the world and other global automotive stats, including cars per capita.
Most cars are in Asia/Oceana
Most of the cars and trucks in the world are in Asia/Oceania2. It has about 40% of all vehicles on this planet, and is a rapidly-growing market for vehicles. Many people think of North America as obsessed with cars, but North America is in third place. Europe, in second place, has 28% of the world’s vehicles while North America only has 23%.
Here is a summary of how many cars there are on Earth in 2026. We use the term “cars” generically, this includes all light, medium and heavy duty vehicles, both personal and commercial. Here’s how many cars and trucks there are in the world, broken down by world region:
1). Asia/Oceania: 676.2 million vehicles on the road. There are 696.8 million projected for 2027. 3 4
2). Europe: 459.1 million vehicles (343.4 million in EU plus 117.1 million in non-EU countries). There are 469.4 projected for 2027. 1 3
3). North America: 386.3 million vehicles in 2026. 391.6 million projected for 2027.
4). South America: 88.9 million vehicles in 2026. 90.8 projected for 2027. 3
5). Middle East: 66.6 million vehicles in 2026. 68.2 projected for 2027. 3
6). Africa: 20.7 million vehicles in 2026. 30.0 projected for 2027. 3
7). Antarctica: about 95 vehicles.
If you want to dig deeper than how many cars are there in the world, then here’s a link if you want to know how many cars there are in the US. And here’s a link if you want to know how old are cars?
How many cars per capita by world region
Here is a breakdown of vehicles (cars and trucks) per capita by world region.
1). North America: 0.72 vehicles per capita/720 vehicles per thousand people
2). Europe: 0.58 vehicles per capita/578 vehicles per thousand people
3). South America: 0.24 vehicles per capita/240 vehicles per thousand people
4). Middle East: 0.14 vehicles per capita/137 vehicles per thousand people
5). Asia/Oceania: 0.13 vehicles per capita/129 vehicles per thousand people
6). Africa: 0.04 vehicles per capita/38 vehicles per thousand people
7). Antarctica: 0.05 vehicles per capita/50 vehicles per thousand people
How many cars per capita by country
Two major countries are virtually tied for the most vehicles (cars and trucks) per capita in the world: The car-crazy United States and New Zealand. In both countries there are about 0.9 vehicles for every person.
On the other end of the scale are Pakistan, Vietnam, the Democratic Republic of Congo, Ghana and Kenya. The countries have 0.03 vehicles per capita, or less.
 Here are the top countries for vehicles per capita and GDP per capita, revised for 2024:
1). New Zealand: 0.90 vehicles per capita/895 vehicles per thousand people/$43,000 GDP per capita. 2
2). United States: 0.89 vehicles per capita/890 vehicles per thousand people/$62,000 GDP per capita.
3). Estonia: 0.82 vehicles per capita/821 vehicles per thousand people/$42,800 GDP per capita. 1
4). Cyprus: 0.79 vehicles per capita/785 vehicles per thousand people/$26,624 GDP per capita. 1
5). Luxembourg: 0.78 vehicles per capita/784 vehicles per thousand people/$115,873 GDP per capita. 1
6). Australia: 0.77 vehicles per capita/772 vehicles per thousand people/$48,300 GDP per capita. 1
7). Canada: 0.77 vehicles per capita/770 vehicles per thousand people/$47,600 GDP per capita.
8). Italy: 0.76 vehicles per capita/757 vehicles per thousand people/$40,600 GDP per capita. 1
9). Iceland: 0.72 vehicles per capita/720 vehicles per thousand people/$55,300 GDP per capita. 1
10). Poland: 0.60 vehicles per capita/604 vehicles per thousand people/$34,700 GDP per capita. 1
11). France: 0.60 vehicles per capita/599 vehicles per thousand people/$44,500 GDP per capita. 1
There’s a lot of confusing sources of information on the internet for this type of search. There’s one web page that shows the most cars in the world per country, per capita, but totally omits the United States. There’s a somewhat popular website that claims Finland has the most cars per capita, citing an old 2015 World Economic Forum report. Rest assured, Finland is not number one in the world.
If you’re citing data, just be aware of which website you use as a source. By the way, in Europe and Asia, cars per capita is called the “motorisation rate” (UK English) or “motorization rate” (American English).
A nation with more than one car per person
If you want to include very small countries, then these two countries would also be on this list of cars per capita.
One country, the Republic of San Marino, is a tiny nation with more than one car per person with 1.3 vehicles per person. Here’s the answer the next time you’re in a trivia contest and get asked, “What is the only nation in the world that averages more than one car per person?” San Marino is only 23.6 square miles. Many of the cars registered in San Marino aren’t physically in San Marino, however. San Marino does not have VAT tax and instead taxes vehicles at either 3.5% or 7%. It’s much less expensive to buy and register a vehicle in San Marino than in surrounding Italy or in the rest of Europe.
• The Republic of San Marino with a population of about 34,000 has around 1,300 vehicles per thousand people and a GPD per capita of $63,500
• The Principality of Monaco with a population of about 39,000 has around 910 vehicles per thousand people and a GDP per capita of $165,000
What about Andorra, a principality on the border between Spain and France? With a population of 77,625 and its status as a tax haven, it sometimes shows up on the list of nations with more than one car per person. We haven’t been able to verify that up to this point so we don’t have those stats. Vehicle registration data from Andorra is very difficult to get.
Motorcycles per capita
Note that this analysis covers cars, vans and trucks, not motorcycles. Countries with a huge number of motorcycles, like Taiwan for example, are not factored into this. In 2023, Taiwan had a population of 23.92 million and 14.38 million motorcycles. They only have 0.30 vehicles per capita/300 vehicles per thousand people, but have 0.67 motorcycles per capita/670 motorcycles per thousand people.
Countries with the least number of cars per capita
 Here are the bottom countries for cars per capita and per thousand people:
1). Democratic Republic of Congo: 0.004 vehicles per capita/about 4 vehicles per thousand people/$5,500 GDP per capita.
2). Pakistan: 0.02 vehicles per capita/20 vehicles per thousand people/$5,500 GDP per capita.
3). Vietnam: 0.03 vehicles per capita/25 vehicles per thousand people/$6,800 GDP per capita.
4). Kenya: 0.03 vehicles per capita/30 vehicles per thousand people/$3,300 GDP per capita.
5). Ghana: 0.04 vehicles per capita/40 vehicles per thousand people/$4,500 GDP per capita.
6). Nigeria: 0.05 vehicles per capita/50 vehicles per thousand people/$5,900 GDP per capita.
7). India: 0.05 vehicles per capita/50 vehicles per thousand people/$7,100 GDP per capita.
8). Philippines: 0.05 vehicles per capita/50 vehicles per thousand people/$8,400 GDP per capita.
9). Iraq: 0.05 vehicles per capita/50 vehicles per thousand people/$16,900 GDP per capita.
10). Egypt: 0.08 vehicles per capita/75 vehicles per thousand people/$11,600 GDP per capita.
We estimate there are about 0.05 vehicles per capita/50 vehicles per thousand people in Antarctica. We’re using the year-round population for that estimate.
Since Russia is in the news so much right now, Russia has 0.37 vehicles per capita/370 vehicles per thousand people (2020).
Frequently asked questions
Q: How many vehicles are there in the world in 2026?
A: According to a May 2026 data analysis by Hedges & Company, there are approximately 1.699 billion vehicles globally. That is projected to grow to 1.738 million in 2027. About 18% of these vehicles are in the United States.
Q: How many of the world’s vehicles are in the United States in 2026?
A: According to a May 2026 data analysis by Hedges & Company, about 18% of the world’s vehicles are in the United States.
Q: Are there more houses or cars in the world?
A: There are more houses in the world. According to the Architecture & Design website, there are 2.3 billion houses in the world. Since there are 1.699 billion vehicles in the world, that means there are more houses than there are cars.
Q: Are there more cars than humans?
A: There are more humans than cars. There are 1.699 billion vehicles on Earth and as of this writing, 8.1 billion humans, so that means there are more humans than cars. There is 1 car for every 4.77 humans in 2026, or 0.21 cars per capita, or 210 cars per thousand humans.
Q: How many vehicles are in North America?
A: According to a May 2026 data analysis by Hedges & Company, North America has 386.3 million vehicles on the road.
Q: How many vehicles are there in South America?
A: According to a May 2026 data analysis by Hedges & Company, South America has 88.9 million vehicles.
Q: How many vehicles are there in Europe?
A: Europe has a total of 459.1 million vehicles, with 343.4 million in EU countries plus 117.1 million in non-EU countries.
Q: Which country has the highest number of vehicles per capita?
A: New Zealand and the United States are virtually tied for the highest vehicles per capita, with about 0.9 vehicles for every person. San Marino, which covers only 23.6 square miles, has 1.3 vehicles per person.
Q: Which countries have the lowest number of vehicles per capita?
A: Pakistan, Vietnam, the Democratic Republic of Congo, Ghana, and Kenya have among the lowest vehicles per capita, with 0.03 vehicles or less per person.
Sources and methodology
1Source: ACEA reports and Hedges & Company forecast. Revised May 2026.
2Source: OICA data projected through 2027 Hedges & Company. Revised May 2026.
3Note: Member countries for these regions have been updated or methodologies updated from previous forecasts, as of May 2026.
4Source: CAAM and JAMA data projected through 2027 Hedges & Company. Revised May 2026.
This article is copyrighted, but it’s polite to share! This content is licensed under a Creative Commons Attribution-ShareAlike 4.0 International License and can be distributed or quoted, with attribution given to Hedges & Company, and a link back to this article from your website.