
Automotive Industry Future Outlook: 2021-2024
The COVID-19 pandemic has changed the future of the automotive industry. We show the current situation and the future of the automotive industry, in just seven charts.
We’ll start by showing you the current impact of the pandemic on the auto industry. Then, at the bottom of this article, we explain how current trends are shaping the automobile industry future.
The future of the auto parts industry: Parts revenue is growing
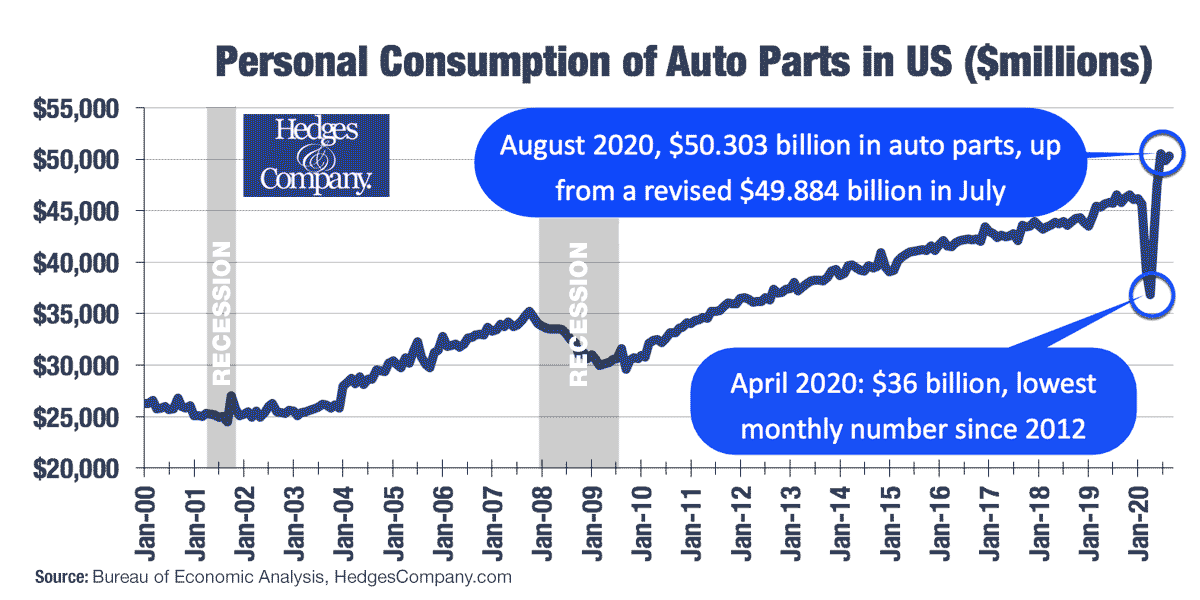
CLICK TO ENLARGE: In August 2020, personal consumption of automotive industry parts reached $50.303 billion, an all-time high. “Personal consumption” includes revenue through automotive parts accessories stores as well as eCommerce.
Chart 1: Automobile parts revenue reached an all-time high in the summer of 2020. When it comes to parts, the automotive industry is traditionally recession-resistant. We see that continuing during the coronavirus pandemic. Personal consumption of automotive parts in August 2020 reached $50.303 billion, an all-time record (see our chart at right).
Update July 2022: Even with inflation factored in, parts revenue continues to grow in 2022. It is forecasted to grow approximately 2% per year for the next decade or so.
“Personal consumption” is the first of several important United States automotive industry statistics in this article. It includes retail revenue only, no B2B revenue. It also includes revenue through top automotive aftermarket retailers as well through as eCommerce. Personal consumption counts all specialty automotive products, performance automotive parts, and automotive accessories. It also includes OEM replacement automotive parts.
We anticipate personal consumption of automotive parts will return to the recent growth trajectory in 2023.
More personal income spent on automotive parts
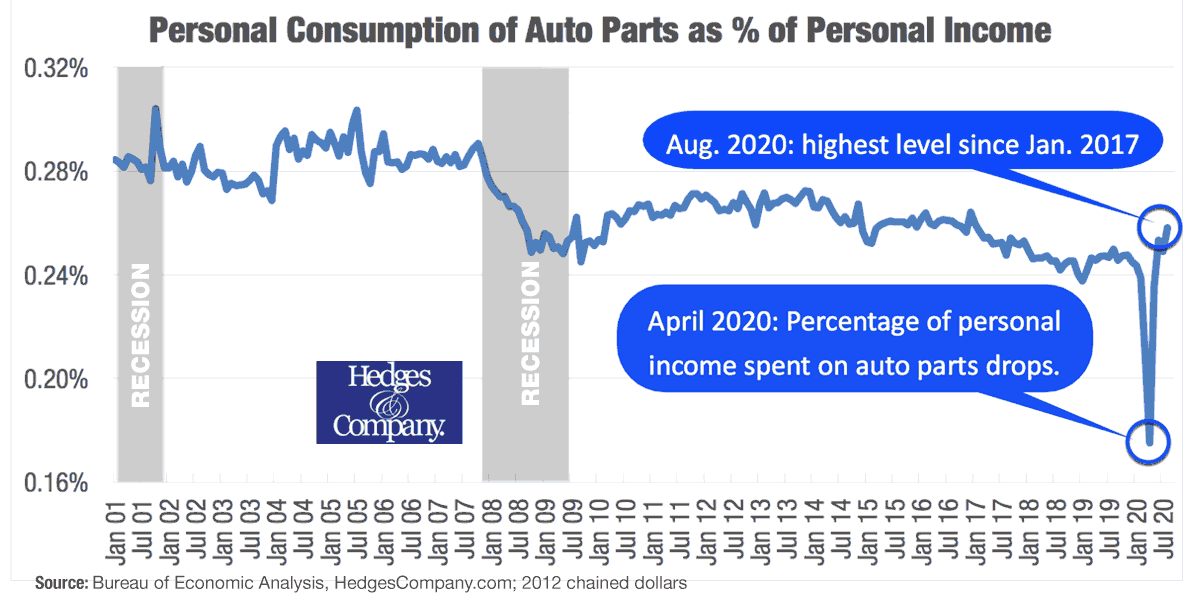
CLICK TO ENLARGE: Continuing through our United States automotive industry statistics, consumers are spending more of their personal income on automotive parts. After a slight downward trend for several years, consumers returned to 2016-2017 levels in August 2020.
Chart 2: During the COVID-19 pandemic, consumers are spending more personal income on automotive parts and accessories (see our chart). Consumers are also spending more of their discretionary income on automotive parts, the shape of the charts are nearly identical.
Update July 2022: Inflation and high gas prices are affecting household decisions on what to spend money on in 2022. The amount of personal income spent on auto parts in the future of the auto parts industry remains unclear.
There has been a slight downward trend in the percentage of personal income spent on automotive parts since 2013, when it peaked at 0.309%. In August 2020, consumers spent 0.291%, marking a return to 2016-2017 levels.
What this means for the future of the automotive industry: Consumers are willing to spend more of their income on automotive parts than in recent years. We anticipate consumer spending as a percentage of personal income will return to the 0.270%-0.280% range by 2023.
Consumers are buying more automotive parts in brick and mortar stores
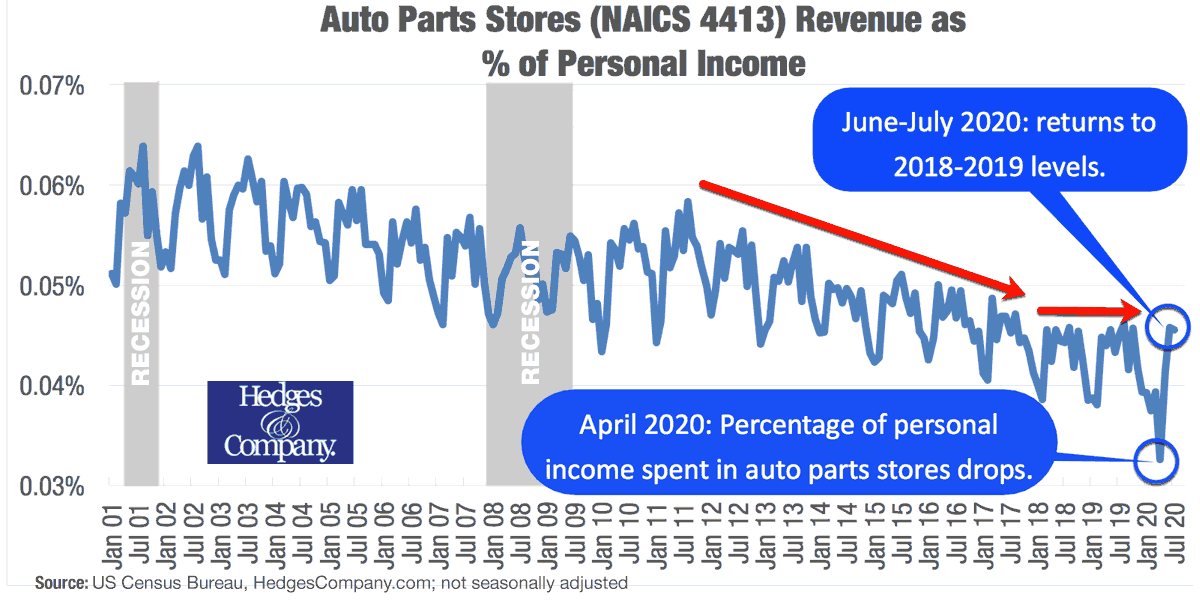
CLICK TO ENLARGE: There has been a long, slow decline in consumer spending in automotive parts retail stores. In recent months it returned to 2018-2019 levels.
Chart 3: Consumer spending in automotive aftermarket retailers returned to 2018-2019 levels. Automotive parts consumers had not been spending much of their personal income in automotive parts stores (NAICS 4413) until the summer of 2020.
Update July 2022: Consumers have returned to retail stores in 2022 and auto parts revenue is growing.
Following the Great Recession of December 2007 through June 2009, consumers spent a higher percentage of personal income in 2010 and 2011, with a peak in August 2011 of 0.058% (see chart). Then there was a long slow decline 2012-2018 (red arrow). This reflects, in part, the growing impact of eCommerce on brick and mortar retail.
In 2019, auto parts store revenue as a percentage of personal income leveled off to match 2018 (short red arrow). In April 2020 it dropped significantly. This summer it returned to 2018-2019 levels when consumers cautiously returned to retail shopping. June and July were about 0.046% of personal income.
In the future of the automotive industry, we anticipate the percentage of personal income will be in the 0.040%-0.041% range in 2023.
Consumers are spending more on automotive parts at the household level

CLICK TO ENLARGE: Households increased their spending on automotive parts every year since the Great Recession (red arrows). Following a drop in April 2020, the average household spent about $400 per month in June, July and August.
Chart 4: Personal consumption of automotive parts & accessories at the household level is at an all-time high (see our chart). Households have increased their monthly spending on automotive parts since the Great Recession (red arrows). This is a great trend for automobile industry future revenue.
Update July 2022: Inflation and high gas prices are affecting household decisions on what to spend money on in 2022. As with personal income above, the amount of money a household spends on auto parts in the future of the auto parts industry remains unclear.
Personal consumption of automotive parts peaked before the Great Recession at $312 in October 2007. It then dropped to the $260 range and grew to $375 at the end of 2019. This is one of the more telling United States automotive industry statistics.
April 2020 had a drop to 2011 levels. In June, July and August 2020 the average US household spent about $400 on automotive parts & accessories. That’s an all-time high (US Bureau of Economic Analysis, US Census Bureau, dollars are not seasonally adjusted, chained 2012 dollars).
We project household spending and personal consumption of automotive parts will return to the recent trajectory in 2012 or 2013.
Why this is shaping the future of the automotive industry: sales of new trucks
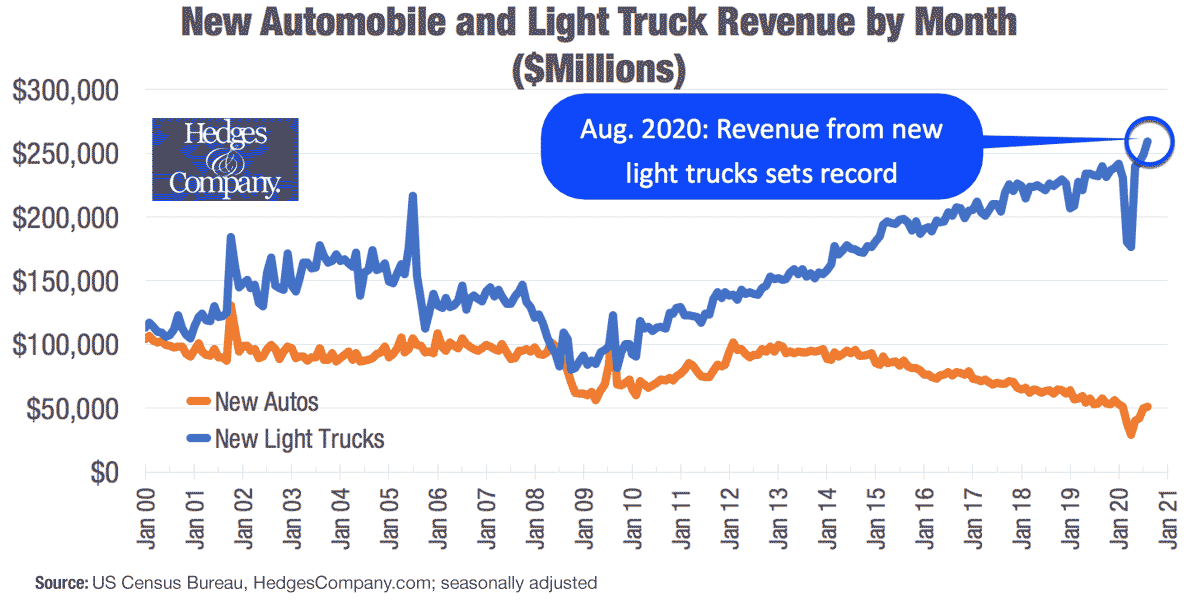
CLICK TO ENLARGE: For every $1 in new car revenue, there is $5 in revenue from sales of new light trucks and SUVs.
Chart 5: New car and light truck revenue is up after a big dip (see chart). New car and light truck unit sales are reported in the press all the time. For now, let’s instead look at revenue. It’s what consumers actually spend on new vehicles and what dealerships take to the bank.
Update July 2022: Light trucks (including SUVs and CUVs) continue to outsell automobiles by about a 2:1 ratio.
Even with the economy suffering in the pandemic, consumers are still buying light trucks and SUVs. In fact, consumers set an all-time record in August 2020.
Here’s one of the biggest United States automotive industry statistics you may not know. For every $1 in revenue generated from new cars, there is $5 in revenue generated from new light trucks and SUVs.
This shapes the future of the auto industry because new trucks drive more accessory sales than new cars.
We project sales of new light trucks and SUVs to remain strong unless affected by a sudden spike in oil and gas prices.
Sales of used vehicles also shapes the future of the auto parts industry
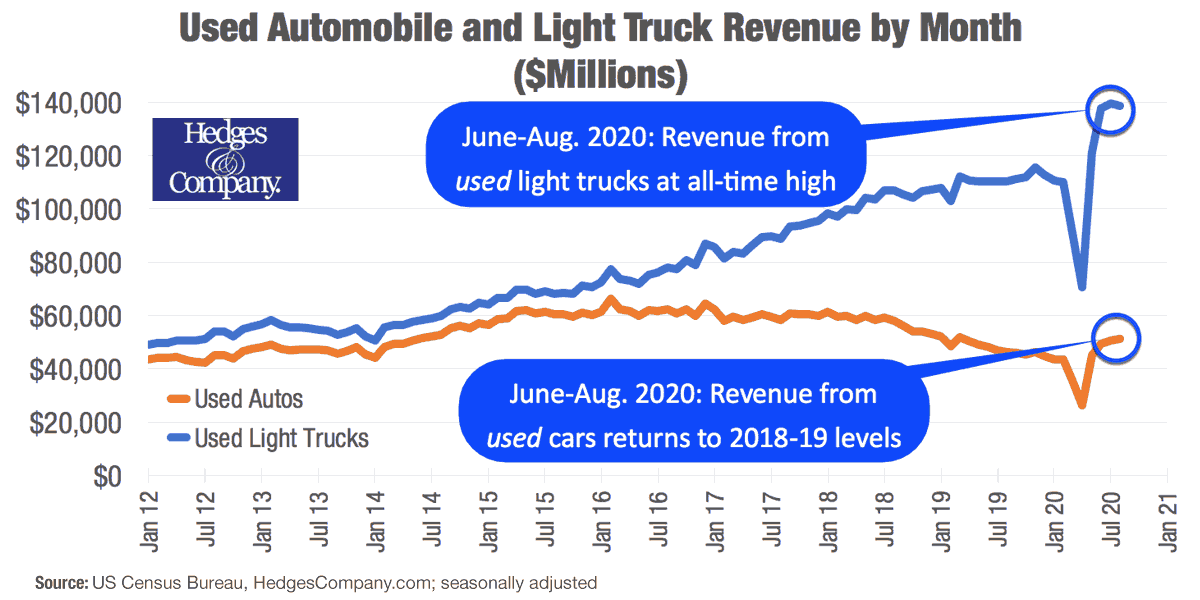
CLICK TO ENLARGE: For every dollar in revenue from used car sales, $2.70 in revenue is generated from used light trucks and SUVs.
Chart 6: Consumers are buying a lot of used light trucks and SUVs, as well as cars (see chart). This chart, like our chart for new vehicles above, shows actual revenue.
Update July 2022: Used light trucks (including SUVs and CUVs) continue to outsell used automobiles.
Again, light trucks and SUVs are producing a lot of revenue for new and used automobile dealers.
For every $1 in revenue generated from used cars, there is $2.70 in revenue from used light trucks and SUVs. This is important for the future of the industry. Not only do sales of used cars and trucks generates accessory sales, but obviously used vehicles need parts in general. They need OEM replacement parts, maintenance parts, service repair parts, and parts to improve appearance.
New vehicles still produce more revenue than used vehicles. For every $1 in used vehicle sales in the United States, $1.59 comes from new vehicle sales.
Consumers haven’t yet fully returned to public transportation and ride sharing

CLICK TO ENLARGE: Consumer spending on public transportation remains down in the coronavirus pandemic, affecting the automotive parts industry.
Chart 7: Consumers aren’t back to normal spending levels using public transportation, or ride sharing like Uber or Lyft (see our chart). Revenue from public transportation, including the airline industry and intracity mass transit, is still down during the pandemic. Revenue from ride sharing like Uber and Lyft is also still down.
Update July 2022: Americans have returned to flying and the 2022 July Fourth holiday weekend saw the highest number of travelers since before the pandemic.
Obviously, this has a lot to do with people working from home. Unfortunately, it also has a lot to do with people who are unemployed.
But this also shows more reliance on personal vehicles for transportation and vacations.
Air transportation revenue is down to March 2011 levels. Revenue from taxis and ride sharing is down to August 2013 levels. Intracity mass transit revenue including buses, subways and trains is down to pre-2000 levels.
Here’s a link to a page with the number of drivers in the US.
Conclusion: United States automotive industry statistics and automobile industry future
We’ve seen that economic trends during this pandemic can shift quickly. We live in uncertain times right now. We just had a national election and there’s a presidential inauguration next month. The an additional economic stimulus package looks like it will pass through Congress. We can’t reliably predict with certainty what 2021 will bring. At least for now the automotive industry looks strong.
Commonly asked questions on the automotive industry
Q: What will be the future of the auto parts industry?
A: Many trends affect the future of the automotive industry, including electronics, internet connectivity, consumer spending on new and used cars, and the COVID-19 pandemic.
Q: How does the economy affect the automotive industry?
A: Automotive manufacturing puts nearly $1 trillion into the US economy every year, from new and used vehicle revenue and from repair service and maintenance. The automotive industry historically contributes between 3% to 3.5% to Gross Domestic Product (GDP) in the US.


Thanks for this amazing blog post.
thoughtful insight.
Wow, very interesting
thank you
Great report, very helpful.
It’s interesting to know that trucks and SUV tend to require more replacement parts the longer you have them. Maybe I should consider buying from a used auto parts dealer in order to have some spare parts ready at all times. That way, I wouldn’t need to worry much whenever I need to do some repairs from time to time.