Auto Parts Chains Staging a Recovery in Retail DIY Revenue
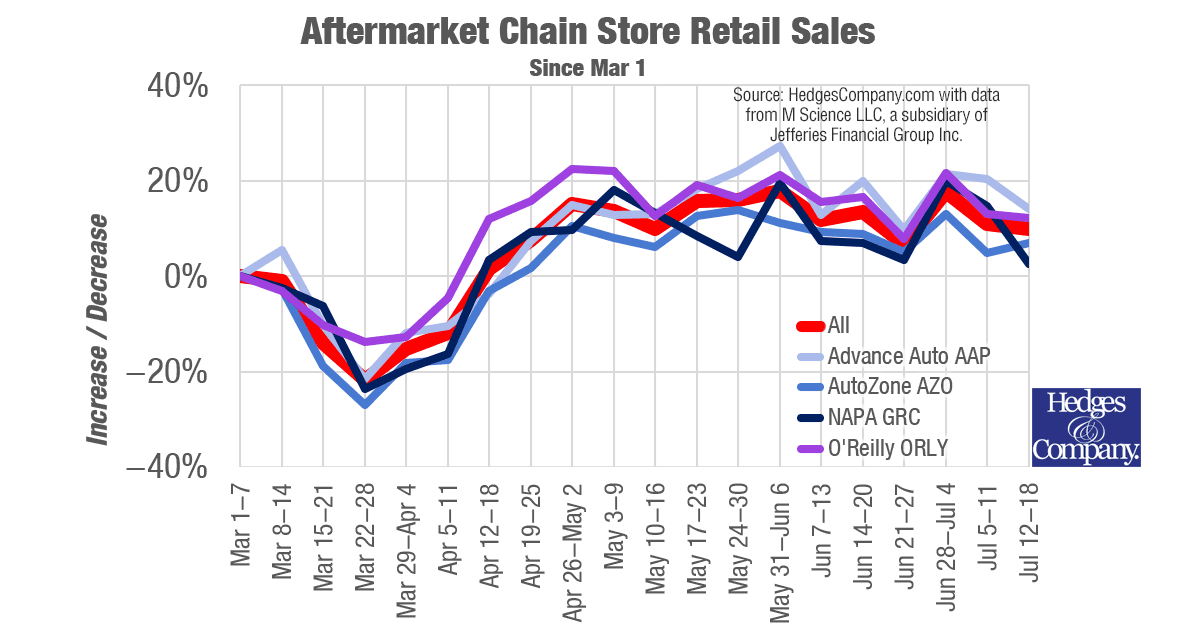
CLICK TO ENLARGE: (July 31) Weekly credit card revenue at major auto parts chains, starting the week of March 1 before wide-spread coronavirus shutdowns. Data courtesy M Science LLC, a subsidiary of Jefferies Financial Group, Inc.
(Updated July 31) According to weekly data from M Science, the top auto parts chain stores are working on a retail comeback during the coronavirus pandemic. M Science is a data-driven research and analytics firm.
M Science tracks credit card transaction data through major retailers including the major auto parts chains. M Science is a subsidiary of Jefferies Financial Group and is a “sister” company to our friends at the Jefferies Automotive Aftermarket Investment Banking team.
The data includes weekly credit card transactions from AutoZone, Advance Auto Parts, O’Reilly Automotive and NAPA Auto Parts (Genuine Parts Company).
Hedges & Company graphed retail data from M Science starting the week of March 1. This is before widespread coronavirus shutdowns were in place. The data shows March and the first week of April had a dramatic reduction in weekly revenue.
Weekly auto parts chain store revenue
Note: this data is updated as of July 31, through the week of July 12-18. Previously published weeks have been revised.
The data shows the week of June 28-July 4 had the biggest increase since the week of March 1-7, at 18%. Weekly increases in June averaged about 12%, while May averaged around 14%. An 8% surge the week of April 19-25 kicked off the recovery in revenue.
That’s a dramatic change from the first six weeks of this analysis, where double-digit revenue decreases were the norm. The first six weeks starting March 1-7 had an average decrease of 11%.
The first positive week, April 12-18, was only up 2%.
Auto parts chains as bellwethers
This data is important because the auto parts chain stores are a bellwether for automotive DIY activity.
Auto parts chain stores can also act as a bellwether for the health of the retail industry in general.
| Week | Change in Retail Sales from March 1-7 (revised) |
|---|---|
| March 1-7 | 0% |
| March 8-14 | -1% |
| March 15-21 | -14% |
| March 22-28 | -22% |
| March 29-Apr 4 | -15% |
| Apr 5-11 | -12% |
| Apr 12-18 | 1% |
| Apr 19-25 | 7% |
| Apr 26-May 2 | 15% |
| May 3-9 | 13% |
| May 10-16 | 10% |
| May 17-23 | 15% |
| May 24-30 | 16% |
| May 31-June 6 | 18% |
| June 7-13 | 12% |
| June 14-20 | 13% |
| June 21-27 | 7% |
| June 28-July 4 | 18% |
| July 5-July 11 | 11% |
| July 12-18 | 10% |
O’Reilly Automotive leading the way: retail sales and DIY revenue
![]() (Revised July 31) O’Reilly Auto Parts (NASDAQ: ORLY) was leading the other auto parts chains through the first week of May. They had back-to-back weeks, April 26-May 2 and May 3-9, with strong 23% and 22% revenue increases respectively. June 28-July 4 was also strong with a 22% increase. O’Reilly Automotive also recovered faster than the others, too, with a 12% increase in the week of April 12-18. (O’Reilly is the purple line in the graph above.)
(Revised July 31) O’Reilly Auto Parts (NASDAQ: ORLY) was leading the other auto parts chains through the first week of May. They had back-to-back weeks, April 26-May 2 and May 3-9, with strong 23% and 22% revenue increases respectively. June 28-July 4 was also strong with a 22% increase. O’Reilly Automotive also recovered faster than the others, too, with a 12% increase in the week of April 12-18. (O’Reilly is the purple line in the graph above.)
O’Reilly Auto Parts has not said if their recent surge is due to strong DIY revenue, or strong DIFM revenue from the service repair industry. However, our friends at Edgewater Research point out that credit card data doesn’t measure DIFM transactions. According to Edgewater any recent surge in revenue is measuring DIY revenue, not DIFM sales.
O’Reilly Automotive is interesting because historically they’re stronger than AutoZone and Advance Auto in the DIFM market. O’Reilly market share of DIFM is strong because they sell to a lot of smaller independent shops. Their strength in DIFM historically has been from better parts coverage and delivery frequency with their stores. We’ll know more when O’Reilly Auto Parts earnings are released.
AutoZone DIY sales up vs. AutoZone commercial sales
![]() (Revised July 31) AutoZone (NYSE: AZO) is stronger in the DIY market than O’Reilly. For example, Edgewater Research sees AutoZone market share of DIY as strong, and puts their sales mix of DIY sales revenue at 77%-78% of total revenue. AutoZone commercial revenue, which serves the DIFM market, is at 22%-23%. It’s interesting to note that the AutoZone annual report for 2019 included the statement they will “…continue to focus on accelerating the growth of our [AutoZone] commercial business” in fiscal 2020.
(Revised July 31) AutoZone (NYSE: AZO) is stronger in the DIY market than O’Reilly. For example, Edgewater Research sees AutoZone market share of DIY as strong, and puts their sales mix of DIY sales revenue at 77%-78% of total revenue. AutoZone commercial revenue, which serves the DIFM market, is at 22%-23%. It’s interesting to note that the AutoZone annual report for 2019 included the statement they will “…continue to focus on accelerating the growth of our [AutoZone] commercial business” in fiscal 2020.
AutoZone had the biggest drop off in weekly revenue, with a low of 27% (AutoZone is the medium blue line in the graph above). They were also slower to recover. The data shows AutoZone is up an average of around 9% in June, on par with NAPA but lower than the other two auto parts chains.
AutoZone runs on a fiscal year, and fiscal 2019 ended August 31, 2019. The impact of the coronavirus pandemic will significantly affect AutoZone’s fiscal 3rd quarter earnings and 4th quarter earnings.
 Advance Auto Parts earnings stronger in DIFM market
(Revised July 31) Advance Auto Parts (NYSE: AAP) is also strong in the DIFM and DIY markets. Advance Auto dipped as low as -22% (Advance Auto is the light blue line in the graph) but was up about 17% in June. Advance Auto market share for DIFM is strong. Their sales mix for DIFM has historically been about 60%, and about 40% DIY. That mix is not reported in Advance Auto Parts financials but is reported in the industry by research companies like Edgewater.
Edgewater also points out that the historic mix of DIFM/DIY for Advance Auto has probably temporarily shifted to slightly more market share for DIY.
AutoZone or Advance Auto Parts: Who’s winning?
When comparing Autozone or Advance Auto Parts, Advance has the advantage right now, with stronger weekly revenue changes vs. AutoZone.
NAPA Auto Parts strong in DIFM sales
 (Revised July 31) NAPA auto parts revenue is strong in DIFM sales. NAPA auto parts are the retail stores of Genuine Parts Company (NYSE: GPC) and operate as franchises. A recent investor presentation shows NAPA sales mix of retail/DIY sales at only 25%-30% of NAPA’s total sales volume (NAPA is the dark blue line above).
Conversely, NAPA auto parts market share of DIFM is stronger than DIY. Their DIFM revenue volume is about 70%-75% of total sales.
NAPA auto parts sales dropped as much as 24% from the first week of March. May 31 through June 27 they were up about 9%.
Advance Auto vs NAPA: Who’s winning?
When comparing Advance Auto vs. NAPA, it’s very close. Over the last three weeks of reporting, Advance had weekly increases of 21%, 20% and 14%, vs. NAPA at 20%, 15% and 3%.
Coronavirus impact on auto chain earnings and eCommerce
Short-term, there’s no question the coronavirus pandemic hurt retail sales and auto parts chain earnings. Auto parts chains were classified as essential services so they remained open while restaurants and other businesses were shut down.
Retail sales in general suffered in March and April, while eCommerce flourished. We don’t know what the permanent impact will be on DIY and DIFM sales activity, but it appears the auto chains are showing a short-term recovery. Most of that recovery is probably DIY rather than DIFM.
Questions on M Science and the data
Let us know if you have questions on this data and we’ll put you in contact with M Science.
Full disclosure: Hedges & Company principals do not directly own stock in the companies mentioned in this article.