
Everything You Need to Know About Vehicles in Operation (VIO)
We get a lot of questions on US vehicle registration data and the vehicle registration database, like “how many cars are in the U.S.?” Here are some important things you need to know about buying and using automotive registration data.
What is car parc? What’s the definition of vehicle parc?
“Parc” is a European term for all registered vehicles within a defined geographic region, originating from the French phrase “parc de véhicules” meaning the collective number of vehicles or a vehicle collection. You may see a reference to “US parc” or “US fleet” when referring to vehicles in operation (VIO). They’re all the same thing as car parc.
Definition of car parc: all vehicles in operation (VIO).
The US car parc is aging. The average age of a vehicle in 2021 is just over 12 years old.
Where does vehicles in operation data come from?
 The original sources for all vehicle registration data we use for analysis are each states’ Department of Motor Vehicles (DMVs), the OEMs (Ford, FCA US LLC, General Motors, Toyota, etc.) and the OEM captive finance companies (an example is Ford Motor Credit Company, LLC, commonly just called “Ford Credit”).
Note that registration data is not the same as our vehicle owner mailing lists, which do not come from DMVs. It is also not the same as our automotive direct mail lists, which also do not come from DMVs.
Each states’ DMV reports data on new vehicle registrations (sales) at the end of each month. This data then goes through an extensive process. It is cleaned up and it is summarized. It is available about six weeks after the close of a month, usually around the 15th of the month. For example, March registration data is available by mid-May.
This vehicle data does not include personal information or VIN numbers due to privacy restrictions and agreements. This data only covers make, model, model year and related information and is not tied to individuals. For data that does include information such as name, address, or other consumer data, we have mailing lists available.
As a general rule our mailing lists cover 67% of all registered vehicles, or about 165 million vehicles and their owners. The vehicle registration data described here covers 99.9% of all registered vehicles, or about 281.3 million vehicles in 2019.
How VIO data is updated each month
 The vehicle registration database goes through an extensive validation and clean up process which is why it takes six weeks before it is ready.
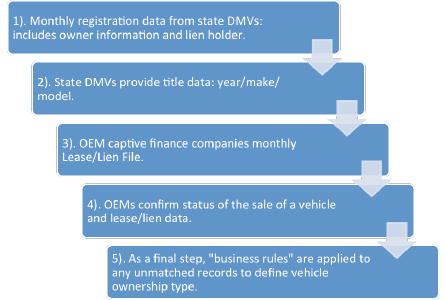
The illustration at the left shows the basic process. First, state DMVs provide monthly registration data including owner information and the lien holder. This data also is revised and updated continuously. Previous months get updated. The state DMVs also have title data such as year, make and model.
Next, the captive finance companies generate their monthly lease/lien file. This file is used for validation. Then the OEMs (original equipment manufacturers) such as GM, Ford or Toyota, confirm the sale of the vehicle and the lease/lien data.
Finally, a set of business rules is applied to fill in the blanks. For example, if a vehicle registrant is a business and the vehicle is not leased, is the vehicle ownership classified yet? If not, in this case it is classified as non-fleet commercial, registered to a business by an individual. This is more than likely a business owner’s personal car registered to and paid for by the business.
Four reasons vehicle registration data is better than government statistics
We’re often asked how the data is different from what the government publishes. After all, why not just download it for free from a government website? This is a common question because many assume the US government would be a great source for all vehicle data. The government is good source for general statistics. We’ll even give you links to government sources below, but there are important differences.
1). VIO reporting is inconsistent from state to state
Stick with us here, because this next section has some amazing revelations on “official” government data.
States are required to report total registrations to the government using form FHWA-561 once per calendar year or fiscal year. The fiscal year for 46 states ends June 30 but four states end in March, August or September. The data is then due to the Federal Highway Administration (FHWA) by January 1 of the following year. This is as much as six months later. A lot of data changes each month, let alone over six months! The data our clients rely on has major updates 12 times per year with continuous updates and maintenance.
For another important difference, states only report the number of total vehicles to the government. They do not report detail on year, make or model. There is also a lag time for data. The most recent data available from the Bureau of Transportation Statistics are for the 2018 calendar year (not to be confused with vehicle model year) and that data is published December, 2019.
Here’s more proof the reporting varies, as crazy as it may seem: The official 2019 FHWA numbers show an increase of 1.121 million vehicles from 2018. In 2019 the automobile industry sold 17 million new vehicles! Where did all the new vehicles go? You may guess that older vehicles were scrapped as new vehicles were sold, but the annual scrap rate for old cars and trucks is about 3% so that still doesn’t account for millions of vehicles “missing” from government data.
It is also important to note that in the most recent file published on the FHWA website for 2019 data, four states (Massachusetts, Nebraska, Oklahoma and West Virginia) have the following footnote:
“Poor quality data; estimated by FHWA based on State reported data or data from secondary sources.“
That same footnote warning appears on the 2018 data for three states: Louisiana, Oklahoma and West Virginia.
2). Vehicle definitions change year to year
Another important difference is that government vehicle definitions and data methods change over time. The Federal Highway Administration included this original footnote in their data through 2011 and we made the important point bold:
“Data for 2007-16 were calculated using a new methodology developed by FHWA. Data for these years are based on new categories and are not comparable to previous years.”
These footnotes are added to the data covering 1960 through 2016, available through the Bureau of Transportation Statistics:
“1960-2006 data are for Passenger Cars and Other 2-axle, 4-tire vehicles, respectively. Data for 1960-2006 are not comparable to data for 2007-15...This edition of [vehicle data] is not comparable to previous editions.“
In other words the government is telling you up front you can’t compare 2007-2016 numbers to earlier years.
3). The government double-counts vehicles, and includes vehicles not in use
There are some important disclaimers on the Federal Highway Administration Office of Highway Policy Information site. We’ve quoted these disclaimers here and made the important points in bold:
“Although many States continue to register specific vehicle types on a calendar year basis, all States use some form of the ‘staggered’ system to register motor vehicles. Registration practices for commercial vehicles differ greatly among States. The FHWA data include all vehicles which have been registered at any time throughout the calendar year. Data include vehicles which were retired during the year and vehicles that were registered in more than one State. In some States, it is also possible that contrary to the FHWA reporting instructions, vehicles which have been registered twice in the same State may be reported as two vehicles.”
This is important to know. In other words, government vehicle registration data includes vehicles no longer in use, and it double counts vehicles within the same state and across multiple states! In one of the most glaring examples of government data changing, in 2010 the government reported 2,235,826 trucks in the state of New York. The government’s 2011 data increased that number to 4,169,695, an unexplained increase of 1,933,869 trucks!
For all the reasons mentioned above, over the past 10 years, the data we use differed from US government data by an average of 3.5 million vehicles per year.
Here’s our official (rounded) count of vehicles in operation (cars and light trucks) by year:
| Calendar Year | TOTAL US CAR PARC |
|---|---|
| 2006 | 246,330,000 |
| 2007 | 249,310,000 |
| 2008 | 251,900,000 |
| 2009 | 252,160,000 |
| 2010 | 249,430,000 |
| 2011 | 249,470,000 |
| 2012 | 248,720,000 |
| 2013 | 248,850,000 |
| 2014 | 252,600,000 |
| 2015 | 257,910,000 |
| 2016 | 264,200,000 |
| 2017 | 270,400,000 |
| 2018 | 279,100,000 |
| 2019 | 284,500,000 |
| 2020 | 286,900,000 |
| 2021 (proj.) | 289,500,000 |
4). The government isn’t a source for detailed vehicle information.
U.S. Government registration data doesn’t include detailed information such as vehicle type, ownership type, engine displacement, MSRP and other details. Government data also doesn’t give an accurate breakdown by state, and does not distinguish between vehicles owned by consumers, businesses, or government agencies. See detail not available from the U.S. government below.
Vehicles in Operation (VIO) reports and analysis
Our analysis utilizes vehicle make, model, year, fuel type (flex fuel, convertible, compressed natural gas, LP/propane, hybrid, electric, gas, or methanol), engine displacement, truck GVW class (weight), MSRP, body style and vehicle segment. This lets us create an analysis to give you a complete understanding of the market.
Vehicle types include convertible, 2 door coupe, CUV, 2-door, 3-door and 4-door hatchback, 2-door and 4-door hardtop sedan, 2-door, 3-door and 4-door liftback, sport, van and wagon.
Please note: We don’t sell registration data outright, we only provide analysis and reporting.
When did VIN codes become standardized?
As a general rule, data for model years prior to 1981 is less accurate. Vehicle Identification Numbers (VINs) are standardized only after 1981. In 1981 the National Highway Traffic Safety Administration (NHTSA) required all OEMs to use a standarized 17-character VIN code which is now in use worldwide. Before 1981 vehicle manufacturers used non-standard VIN codes that were as short as 11 characters or as long as 17 characters. It is impossible to track all of these vehicles consistently in one central database. Standardized VIN codes also helped NHTSA issue and monitor vehicle recalls for safety problems.
Vehicle makes available for VIO analysis
All major makes are in the vehicle registration database. This includes discontinued makes such as Pontiac or Oldsmobile. The data includes Acura, Audi, Bentley, BMW, Bugatti, Buick, Cadillac, Chevrolet, Chrysler, Daewoo, Dodge, Fiat, Ford, Geo, GM, GMC, Honda, Hummer, Hyundai, Infiniti, Isuzu, Jaguar, Jeep, Kia, Lancia, Land Rover, Lexus, Lincoln, Mazda, Mercedes-Benz, Mercury, Mini, Mitsubishi, Nissan, Oldsmobile, Plymouth, Pontiac, Ram, Saab, Saturn, Scion, Smart, Subaru, Suzuki, Tesla, Toyota, Volkswagen and Volvo.
Vehicle registration statistics on HedgesCompany.com
We have summary-level information on vehicle registration statistics available here. We have been a source for vehicle data for various news outlets including NBC Nightly News with Brian Williams, Bloomberg Businessweek, the Wall Street Journal’s MarketWatch, the Denver Post, the Detroit News and the Seattle Times.
Feel free to contact us if you have any additional questions on vehicle data. For more information watch our YouTube video:


I am a recently retired developer who is looking to create a mapping website showing information on hybrids and electric vehicles.
I am interested in a dataset by zip code containing these vehicle registrations.
Thanks
Hi Tim, thanks for stopping by our blog. We rely on complete datasets on hybrids and EVs to produce our derived reporting. We’ll send you an email with information.
I am interested in registration data for Jeep Wrangler JK by zipcode. Could you send me some information regarding the availability of this information?
Hi Wyatt, thanks for your interest in our vehicle registration data. We sent you a follow up email. Please let us know if you have any additional questions.
We have also just posted a new Frequently Asked Question page on vehicle registration data.