
Auto Parts Sales: Is Google Forecasting a Good 2nd Quarter?
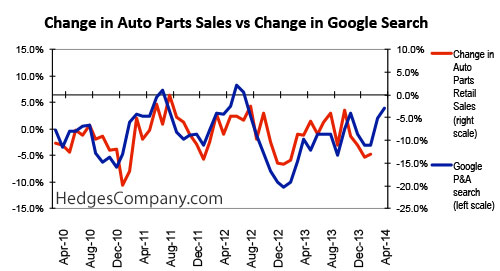
This chart compares the change in search volume for the Vehicle Parts & Accessories category on Google, to the change in sales volume for auto parts, accessories and tires through auto parts retail stores.
A promising second quarter of 2014 for auto parts and tire sales may be on the way, based off data from Google Trends.
![]() The ability to use Google Trends to forecast certain things such as flu outbreaks is well documented. We used data from Google to plot changes in search volume for the Vehicle Parts & Accessories search category (blue line), against changes in retail sales of auto parts, accessories and tires (red). The correlation is stunning.
The ability to use Google Trends to forecast certain things such as flu outbreaks is well documented. We used data from Google to plot changes in search volume for the Vehicle Parts & Accessories search category (blue line), against changes in retail sales of auto parts, accessories and tires (red). The correlation is stunning.
This chart shows changes in search volume for all searches in the US in the Vehicle Parts & Accessories category. This is plotted against against changes in retail store sales. For Google Trends we used data from January 2009 through April 2014, and for retail sales we used January 2009 through February, the most recent data available.
Automotive industry trend forecasting
What is interesting about the chart is the uptick in auto parts and accessory search volume in March and April (blue line). If the correlation continues as it has over the past several years, we should also see an increase in retail sales as well. Whether Google’s uptick continues to increase through May remains to be seen.
Google Trends takes the highest point within a date range and indexes all other months against that, so we did the same thing, using August, 2011 as our high point. That month has the highest volume of auto parts, accessories and tire sales through auto parts stores (NAICS 4413) on record.


Where is the updated data to know more about the automotive industry sale volume , as far as i know its in better position than before.